| 4 |
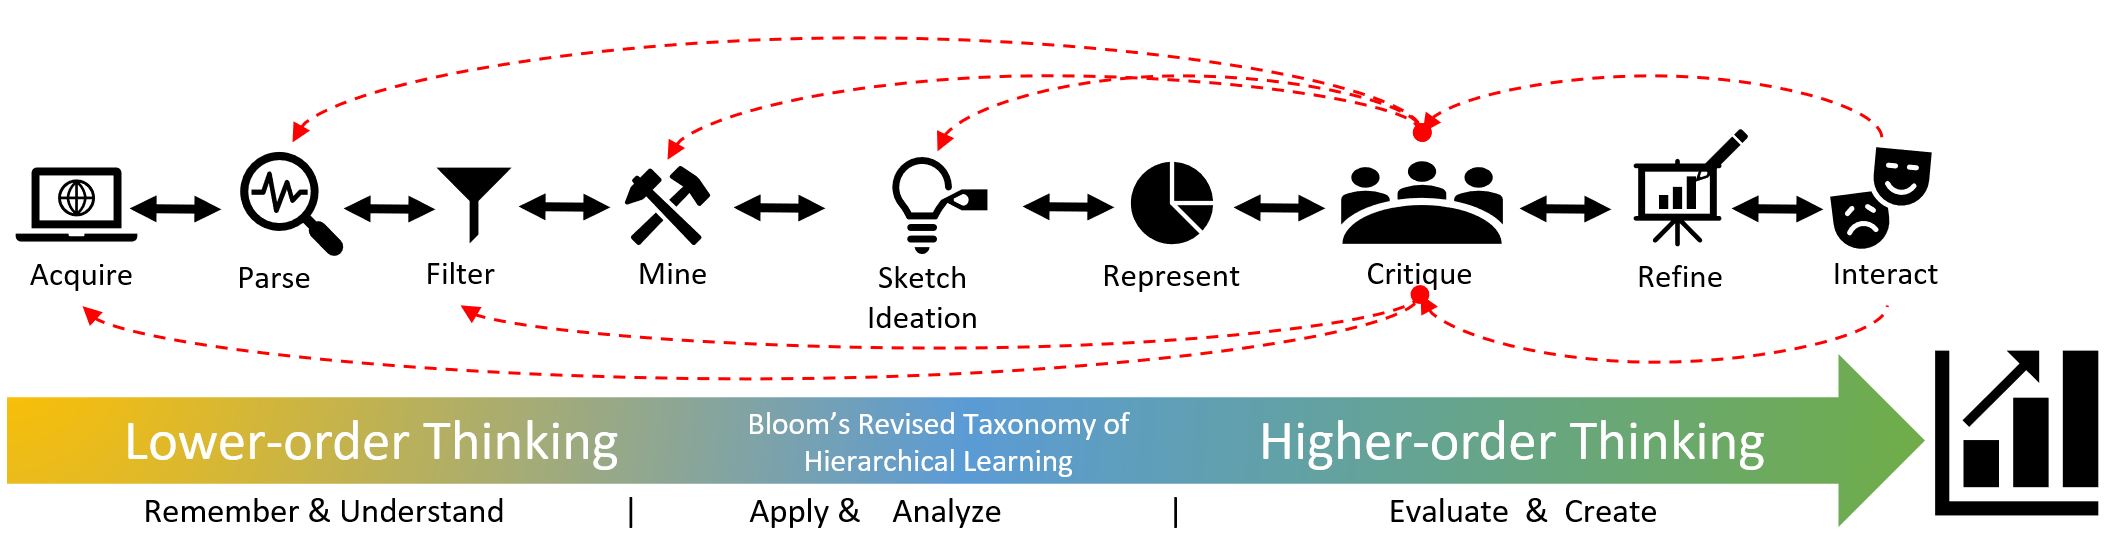
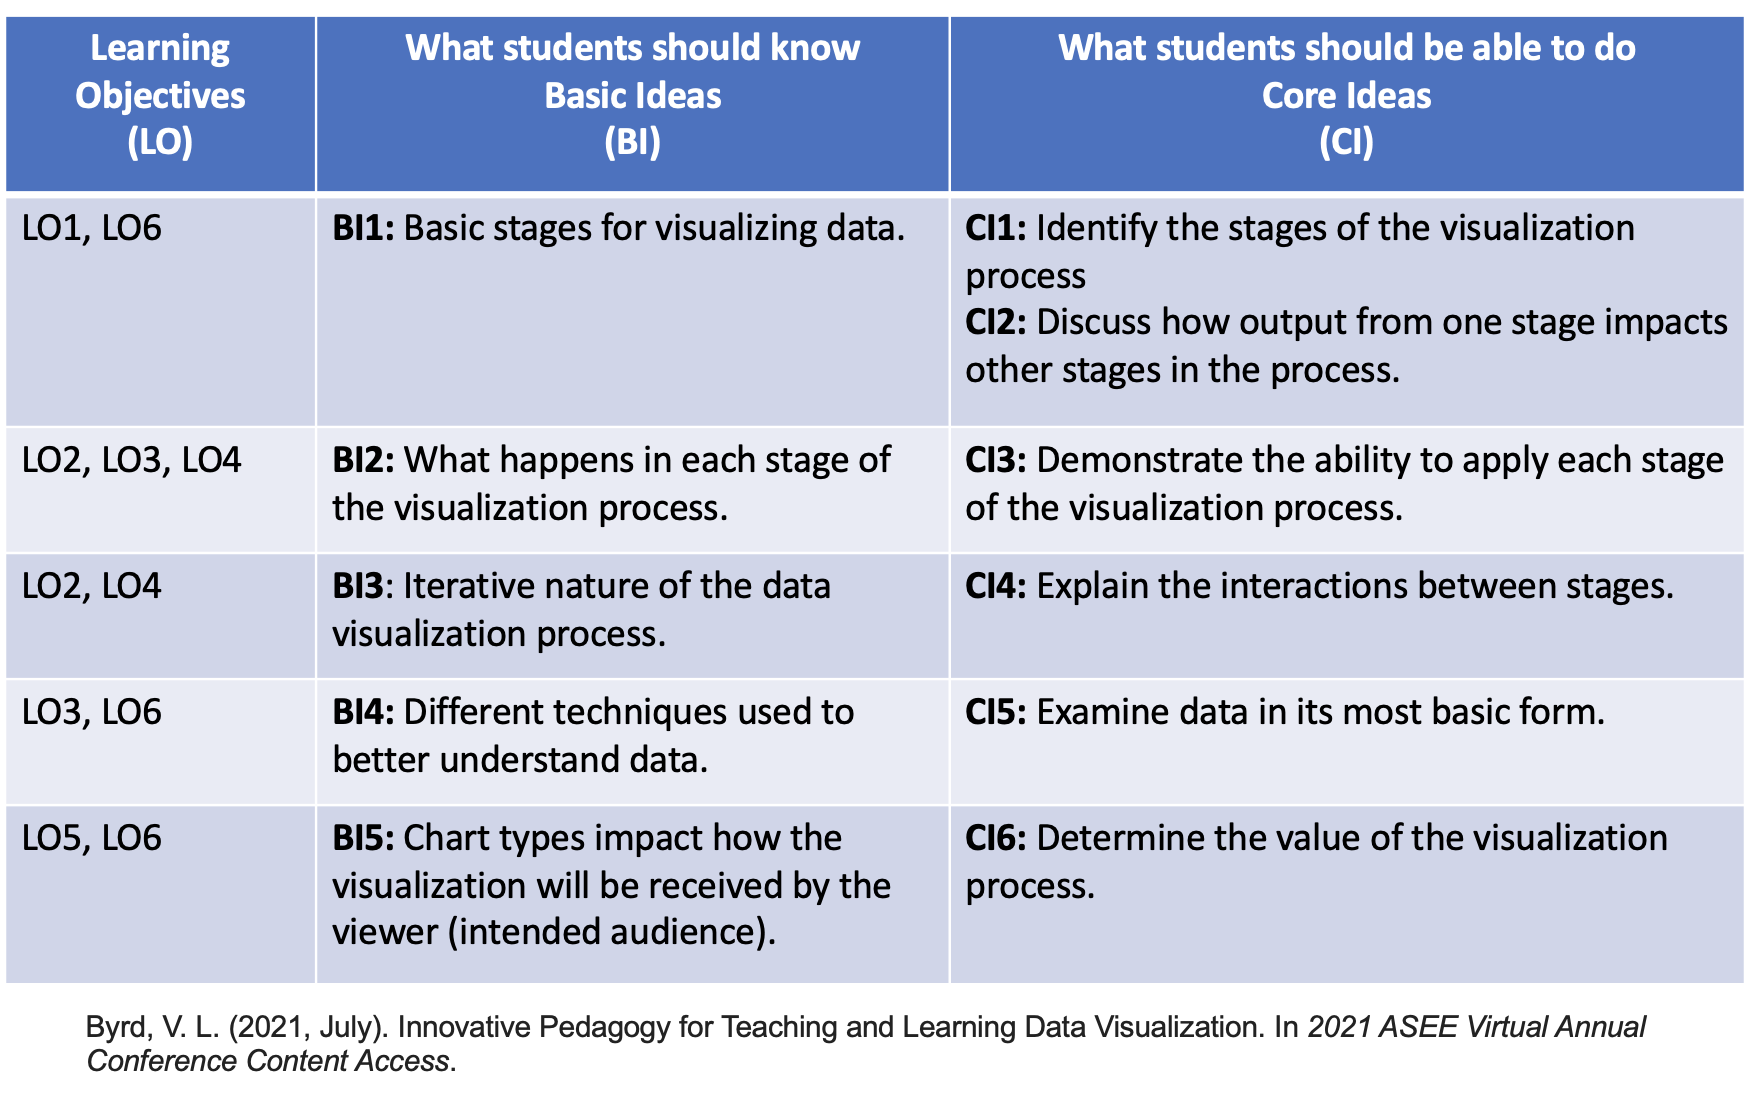
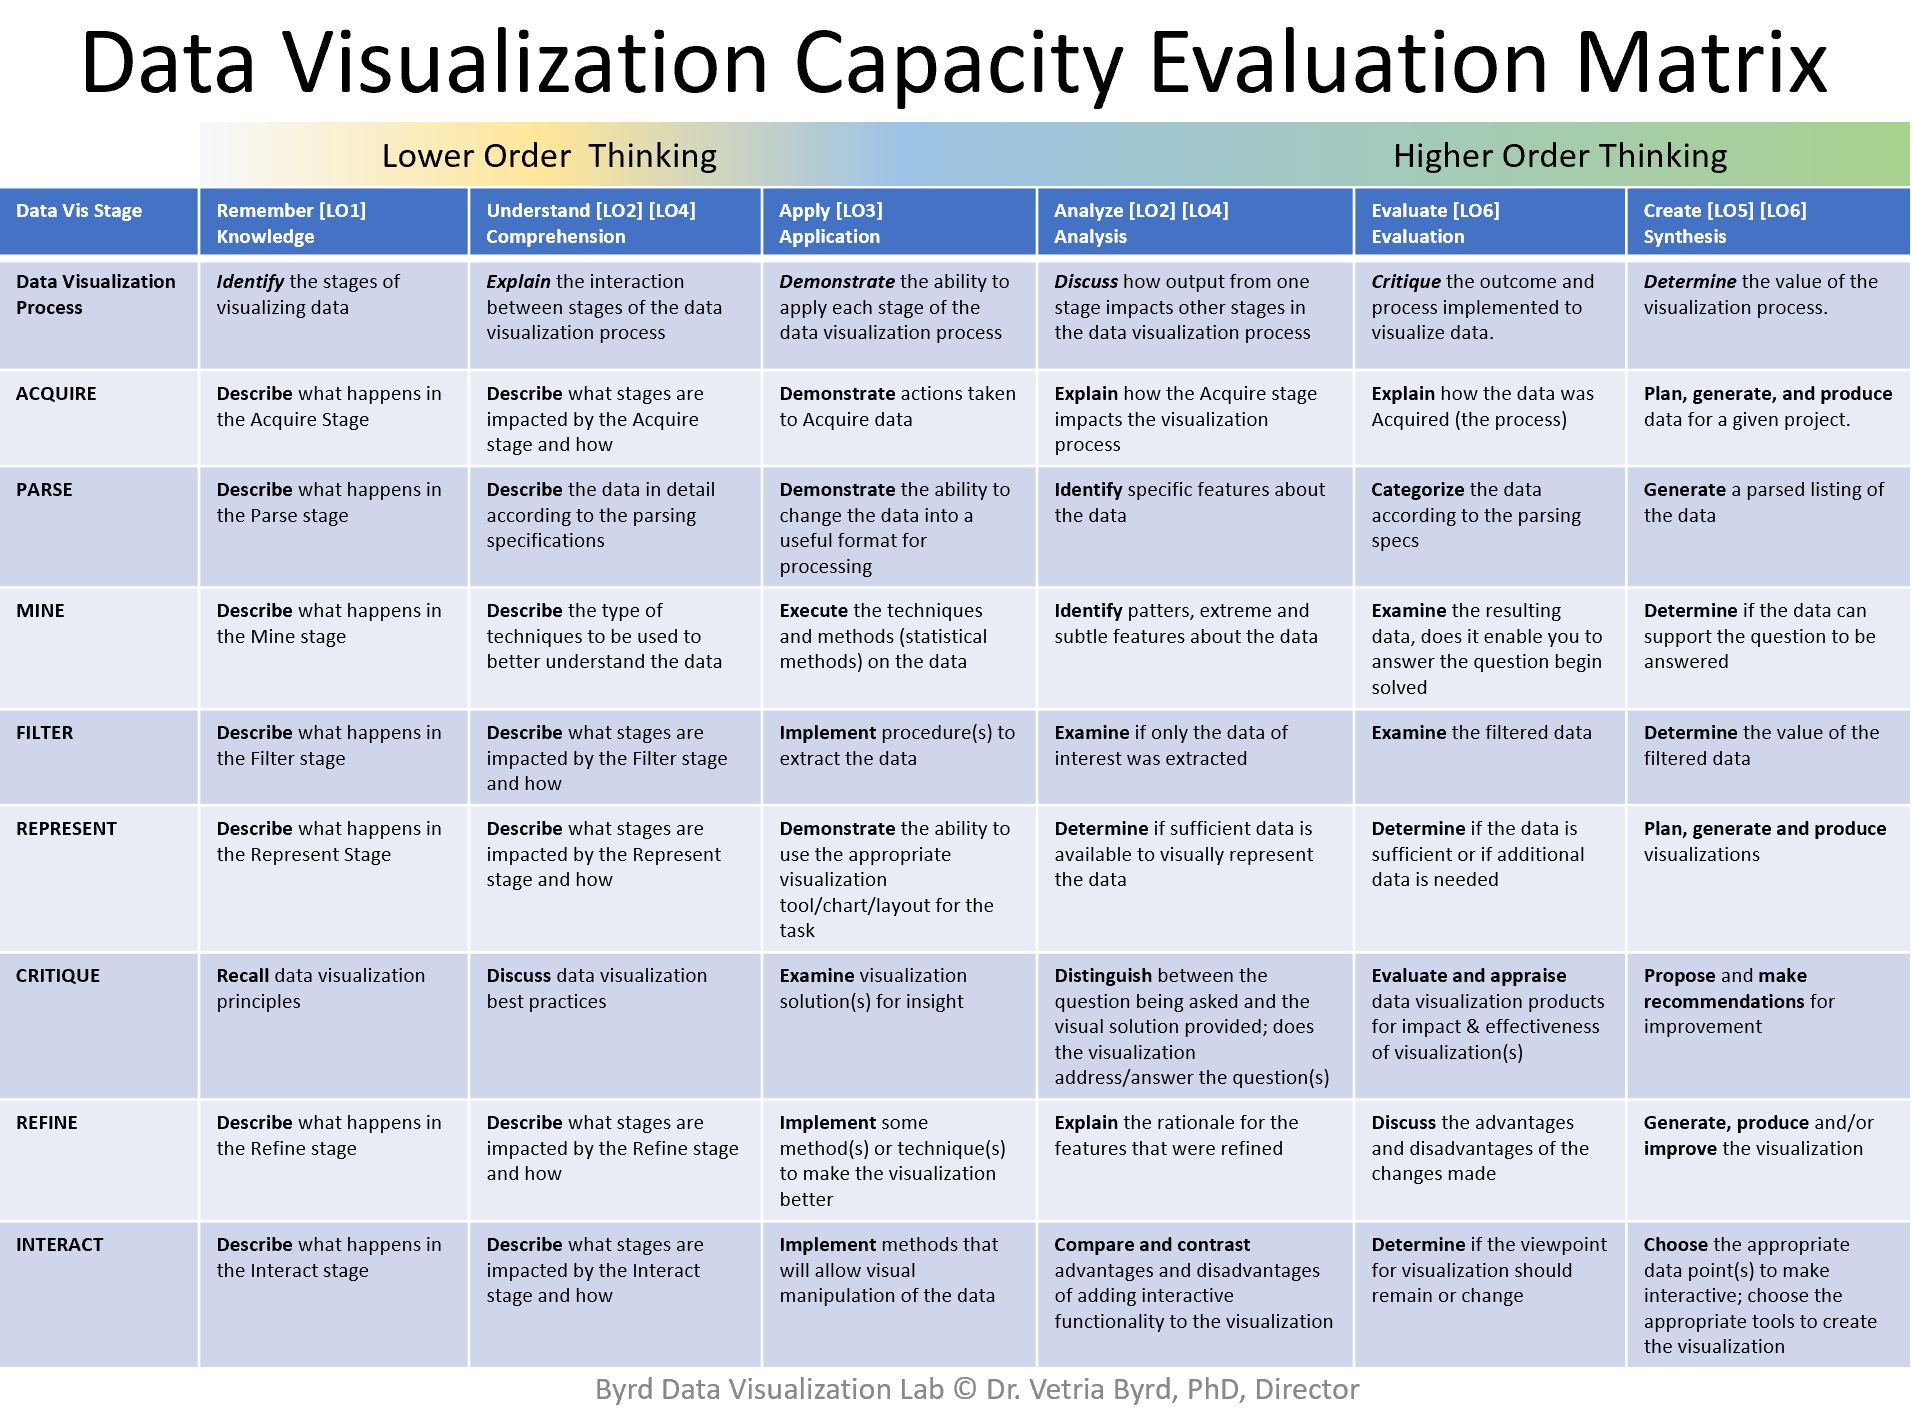
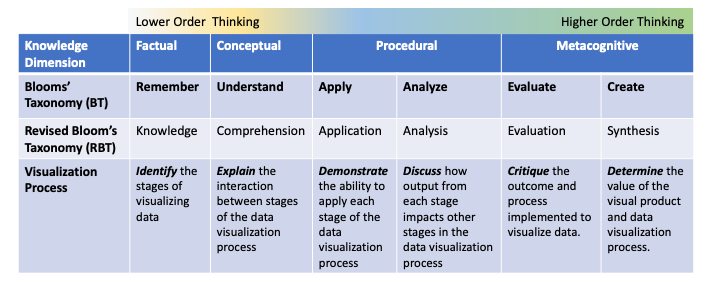
- Clearly articulate what happens in each stage of the data visualization process.
- Accurate, complete interaction between each stage of the data visualization process.
- Demonstrate the ability to apply each stage of the data visualization process.
- Discuss how output from each stage impacts other stages in the data visualization process.
- Clearly evaluate and appraise data visualizations for impact, effectiveness, and insight.
- Create visualizations that clearly show significant relationships that exist within the data, articulates assumptions and presentation of all relevant assumptions and point of view.
- Demonstrates data visualization best practices.
|
| 3 |
- Clearly articulates what happens in some stages of the data visualization process.
- Accurate, mostly complete interaction between some stages of the data visualization process.
- Demonstrate the ability to apply some of the stages of the visualization process.
- Discuss how outcome from some stages impact other stages in the data visualization process.
- Evaluate and appraise some data visualizations for impact, effectiveness, and insight.
- Create visualizations that show some relationships that exist within the data, present some relevant assumptions and point of view.
- Demonstrates some data visualization best practices.
|
| 2 |
- Identifies each stage of the data visualization process.
- Accurate but incomplete interaction between stages of the data visualization process.
- Simplistic demonstration of what happens between stages that ignores the iterative, non-linear nature of the process.
- Discuss how output from one or two stages impact the data visualization process.
- Articulates insignificant or illogical implications and consequences that are not supported by evidence (data), lacking insight.
- Creates visualizations that are simplistic and ignores feedback and point of view.
- Demonstrates a few data visualization best practices.
|
| 1 |
- Unclear articulation of stages of the process.
- Inaccurate, incomplete demonstration of interactions between stages of the data visualization process.
- Incomplete demonstration of what happens between stages that ignores the iterative, non-linear nature of the process.
- Fails to discuss the impact of each stage on other stages in the process.
- Generates invalid implications and consequences based on irrelevant evidence (data)
- Incomplete presentation that ignores relevant assumptions and point of view.
- Fails to implement data visualization best practices.
|